
Poverty reduction, human capability and economic security in India
THIS aspect is crucial when analysing development issues in India. Poverty metrics are valuable indicators for assessing economic and social progress; however, it is essential to examine how individuals experience changes when they rise above poverty. Research emphasises the need to evaluate whether these individuals achieve stable livelihoods, access healthcare and education for their children, and manage their income effectively, as well as their families’ ability to handle unexpected expenses. This article aims to enhance the understanding of development indicators. It focuses on the relationship between improved living standards and the opportunities available to individuals. While higher living standards are generally viewed positively, they do not necessarily guarantee a secure future for families or equitable access to state services across all population groups.
Assessing Development Beyond Poverty Reduction
India’s achievement of eradicating measured poverty is therefore a very significant achievement. According to the World Bank’s October 2026 Poverty and Equity Brief, the proportion of the population living in extreme poverty (defined as those living on less than $3 (approximately Rs 280) per person a day in 2021, in 2021 PPP terms) has fallen from 27.1% in 2011-12 to 2.6% in 2023-24. At the lower-middle income line of $4.20, it has halved from 57.7% to 16.1%. The World Bank puts the number of people who have crossed the $4.20 line at 496 million.
This achievement is notable; it is essential to assess the broader socio-economic impacts of poverty alleviation on those affected. A household may see an income increase without achieving financial stability, failing to save, secure stable employment, or acquire property. Likewise, a child might attend school but not gain the necessary skills for higher education or meaningful employment; a woman can contribute to household productivity without compensation, leading to a lack of control over the family’s financial decisions.
So, in the next phase of India’s development, poverty reduction has to go beyond these improvements in the material standard of living to a greater degree of economic security and an improved human capability. That’s the principle that underpins the work of the great Indian Nobel Laureate in Economic Sciences (1998), Amartya Sen, the eminent economist and philosopher who is now one of the world’s leading scholars on welfare economics, inequality and human development. In his seminal works — Commodities and Capabilities (1985) and Development as Freedom (1999) — the Nobel laureate argues that development should be understood in terms of the real freedoms people have to live the lives they have reason to value, and that the principal means to development are the expansion of people’s capabilities — in other words, what they can do and be.
The Human Development Index (HDI) of the UNDP does, of course, recognise the importance of health, education and standard of living. The capability approach and the HDI have not in any way asserted that a single indicator is sufficient to measure the whole quality of human life. What they have done is to underline the importance of having a wider assessment of whether social and economic arrangements can, in fact, improve real opportunities.
The key difference in development outcomes in India lies in how poverty is measured. The monetary poverty indicator assesses consumption against a financial threshold, while the multidimensional poverty indicator looks at deprivations in health, education, and basic living standards. Labour force participation simply indicates whether one is in the workforce, without reflecting job quality or pay. School attendance doesn’t guarantee skills, and healthcare access may be costly or ineffective.
All indicators need an equity lens, requiring state-level data to be disaggregated by sex, location, income, social group, and district. This should continue until there’s no sound basis for further disaggregation by religion, sex, and district, given the lack of official data.
Understanding Poverty Statistics
While the new estimates provided by the World Bank in October 2026 are significant in highlighting progress made with monetary poverty in India, it is important to note that there are two different international poverty thresholds. The $3 threshold refers to extreme monetary poverty, whilst the $4.20 threshold refers to the international poverty line for lower middle-income countries. The World Bank estimates that around 35 million people remain in monetary extreme poverty below the $3 threshold and around 232 million people continue to be in poverty below the $4.20 threshold in 2023-24.
However, it is wrong to refer to the estimated 496 million people who have crossed the $4.20 threshold as having escaped extreme poverty. The difference in monetary poverty thresholds must be taken into account. These figures are in 2021 PPP, meaning the different purchasing power parity between countries has been accounted for. International poverty lines help to compare the data but do not give us a complete view of the cost of living in India.
Households may still be vulnerable to illness, unemployment, debt and the increasing costs of education and healthcare if they are close to the international poverty level.
The World Bank also highlights that the consumption-based Gini has fallen from 28.8 in 2011-12 to 23.0 in 2023-24. However, the bank also highlights that household consumption surveys may not fully represent the consumption of the wealthiest households, meaning the inequality could be underestimated. Furthermore, median earnings of workers in the top decile were around 13 times higher than the earnings of workers in the bottom decile in 2023. This proves the importance of looking at the distribution of economic opportunities.
The 2023-24 survey was not conducted in the same way as was done for 2011-12. The survey was split into modules, whereas in 2011-12 all the data was collected using one questionnaire. This means that in 2023-24 a different sample of households was surveyed. The range of questions asked and the recall period may change, meaning it can be harder to compare the results.
The World Bank has attempted to overcome these issues by adjusting the methodologies. It adjusted the baseline of consumption using the Modified Mixed Reference Period and ensured variables were standardised. The reproducibility package also means we have a better idea of what calculations were used. However, this does not guarantee that all variables have been fully accounted for. A bridging survey would have helped to give a better insight into how much of the change is due to improvements in consumption.
There have been recent discussions about this. Pintu Paul, an economist looking at poverty and measuring household consumption in India, has spoken about how the surveys are comparable and how a bridging survey is important. Santosh Mehrotra, an economist and public policy scholar who previously held the position of Professor at Jawaharlal Nehru University and was a senior official in the Planning Commission of India, has also looked at the problems with comparing household consumption surveys.
Eeshani Kandpal, a development economist who has worked as a Senior Economist in the World Bank’s Development Research Group and Senior Fellow at the Centre for Global Development, has also looked at this issue. In her analysis in November 2026, she acknowledges that the World Bank have made attempts to standardise the data but questions how confident we can be that the changes are attributed to changes in consumption. She also highlights how the extreme poverty rate has fallen significantly from 5.3% in 2022-23 to 2.6% in 2023-24 and how this needs to be explained carefully.
Whilst this does not prove that the estimates are incorrect, it does highlight how important it is to be transparent with the assumptions, adjustments and uncertainties.
It is also important to highlight that there is a difference between monetary poverty and multidimensional poverty. In 2024, NITI Aayog produced ‘Multidimensional Poverty in India Since 2005-06: A Discussion Paper’ using the NFHS-4 and NFHS-5 data. This found that the proportion of multidimensionally poor people was reduced from 24.85% in 2015-16 to 14.96% in 2019-21. Around 135 million people moved out of multidimensional poverty. This uses an index looking at health, education and living standards and is not another estimate using the international monetary thresholds.
There are four questions to ask ourselves when discussing this in the public eye. How accurately have we measured the decline in poverty? What are the contributing factors? How evenly have the improvements been distributed? Are the improvements sustainable? This helps to create a more meaningful discussion.
Income, Wealth and Consumption
These three features are closely related but have distinct meanings. Consumption refers to goods and services used by a household over a certain time frame. Income relates to the amount of money a household receives from employment, self-employment, transfers, rent and so on. Wealth refers to the value of assets a household has after taking liabilities into account. This includes assets such as land, homes, financial investments and business ownership.
The Household Consumption Expenditure Survey (HCES) 2023-24 shows that income inequality has reduced between 2022-23 and 2023-24. The Gini coefficient has fallen from 0.266 to 0.237 in rural areas and from 0.314 to 0.284 in urban areas. This, therefore, shows that there is less inequality in household consumption expenditure between the two rounds. However, this does not show that there has been the same reduction in income and wealth inequality.
This is because household consumption surveys do not give us a full picture of how concentrated income and assets are. A household may have high consumption but very little wealth, lots of debt or an unreliable income. Alternatively, a household may have high-value property or financial assets, but this will not be reflected in their consumption.
In 2026 Nitin Kumar Bharti, Lucas Chancel, Thomas Piketty and Anmol Somanchi produced research looking at inequality in India from 1922 to 2023. This is titled ‘Income and Wealth Inequality in India, 1922–2023: The Rise of the Billionaire Raj’. Using national accounts, tax data, wealth estimates, rich lists and household surveys they found that the top 1% received 23.3% of the national income and had 40.1% of wealth in 2022-23. This research helps in understanding how concentrated the economy is,v rather than a direct measure.
Gender is another factor to consider. We do not know who is controlling the money being spent from the household expenditure data. We do not know who owns the house/land or who is making decisions about saving. We do not know if women and girls have equal access to nutrition, healthcare, education, digital devices and financial services. There may be inequality in how resources are distributed within the household.
To fully understand how much inequality there is within the economy, we need to look at income, assets, land ownership, home security, debt and how much control women have over resources. If households are consuming more, but have improved financial security and decision-making power, then this makes poverty reduction more meaningful.
Employment, Earnings and Household Economic Wellbeing
Increased consumption, employment, female participation and social benefits such as food subsidies have all been cited by the World Bank as reasons for the decrease in poverty in India. Whilst these factors can be seen to have a significant effect on improving household wellbeing, we must look more closely at employment.
Increased consumption can happen even if individuals aren’t earning much; the addition of an extra earning hand can help increase resources within the household. Social benefits such as food transfers can help reduce the amount of money individuals need to spend on essentials within the household. This can help uplift their standard of living and prevent extreme deprivation. We shouldn’t disregard social benefits as they aren’t earned.
However, whilst increased consumption can occur, this does not necessarily mean individuals have increased savings and assets. Households with low income, informal or public sector employment may still be vulnerable to unemployment, ill-health and increased costs. Social benefits and productive employment should therefore be seen as complementary.
A 2026 study by Review of Agrarian Studies titled ‘Rural Growth and Distribution: Two Narratives from the PLFS 2017-23’ looked at the changes in income of rural households. Using data from the Periodic Labour Force Survey, the authors found that individuals had seen a modest increase in real wages. However, some sections of the rural distribution saw an increase in their per capita incomes. This was due to an increase in the number of earners within the household, increased labour force participation and a shift towards non-farm and self-employment. Note that this is only applicable to rural households.
Therefore, this should be interpreted alongside data relating to wages, employment, working conditions, social benefits and consistent earnings. The PLFS 2025 Annual Report found that 57.4% of individuals aged 15+ were in employment. However, this doesn’t necessarily mean they’re earning sufficient wages, working consistently and having social benefits.
Quality employment is going to play a key role in sustainable poverty reduction. If individuals aren’t earning a consistent income and don’t have any protection from shocks, then whilst they may have crossed the poverty line, they may not have security to stay above it. Policies should therefore aim to increase individuals into productive, well-paid and consistent employment.
Female Employment
Female employment is a key indicator of economic change but must be interpreted carefully. The PLFS 2025 Annual Report indicates that only 40% of females aged 15+ are employed, compared to 79.1% of males, revealing a significant gender gap. Many females are in roles such as self-employment or unpaid family work, which may not provide independent income yet contribute to household economics.
The report notes that 44.4% of those not in employment cite childcare or household commitments as their main reason, highlighting the impact of unpaid care work. According to the Time Use Survey 2024, 41% of females aged 15-59 engage in unpaid caregiving, spending an average of 140 minutes per day compared to 74 minutes for males.
To understand female economic engagement, we should ask whether they are in paid, secure, and consistent employment, as well as whether they have access to resources like childcare, mobility, and credit. It’s essential to assess whether employment leads to greater autonomy and control over earnings and assets. Despite rising employment, true empowerment requires control over income, opportunities, and reduced caregiving burdens.
Food, Nutrition, and Health
Social benefits related to food support household consumption, but access to staple foods does not guarantee nutritional security. The National Family Health Survey reveals significant health issues, including malnutrition and anaemia. Health outcomes are influenced by various social determinants, such as income, education, and living conditions.
India’s life expectancy is 71 years, but healthy life expectancy is only 60.6 years, indicating that many live with illness. To improve health outcomes, we need affordable and effective healthcare. Households facing health shocks often regress in living standards, emphasising the need for access to quality healthcare and protection from medical costs.
Education
Education is crucial for human development, but mere enrolment doesn’t ensure effective learning. Many students lack basic literacy and numeracy skills, and dropout rates are concerning. The NITI Aayog report found that 11.5% of students dropped out of secondary education, underlining the issues around quality, infrastructure, and progression in the education system.
The relationship between poverty, education, and gender inequality is crucial when examining districts facing social and economic deprivation. The Sachar Committee Report (2006) highlighted the socio-economic and educational challenges faced by Muslims in India, emphasising the need for accurate, community-sensitive data and effective policies.
The report raised important policy questions about identifying deprivation and ensuring that schemes indeed reach the communities they are intended for. Following its findings, the Government of India identified 90 Minority Concentration Districts based on census data, focusing on relative deprivation indicators like literacy and access to basic amenities. This informed the Pradhan Mantri Jan Vikas Karyakram (PMJVK), which aims to enhance infrastructure for education, health, and women’s facilities.
The PMJVK should be evaluated based on the functionality and reach of its projects. Various data sources, including the 2011 Census and administrative data from UDISE+, NFHS, AISHE, and PMJVK, provide insights but can be unreliable when broken down by religion and gender.
The NCMEI Committee on Girls’ Education addressed the challenges faced by minority girls, leading to recommendations that remain relevant today. Revisiting these with current data is essential to assess ongoing barriers.
In summary, to effectively reduce poverty and expand human capability, we need to ensure that women and girls in deprived districts gain access to quality education, healthcare, livelihoods, and public services, supported by reliable data and effective policy implementation.
Demographics, Technology and Institutional Capacity
India’s demographic transition presents an opportunity but also a challenge. Based on population projections produced by the Technical Group on Population Projections under the National Commission on Population, the proportion of the population aged 15-59 will increase from 60.7% (2011) to 64.9% (2036). The population aged 60+ will increase from around 10 crore to 23 crore (8.4% to 14.9%).
Having a large working-age population can help boost economic growth; however this will only happen if individuals are healthy, educated, skilled and have access to productive employment. If there aren’t enough opportunities, then individuals will face unemployment, underemployment and insecure employment. An ageing population will require improved healthcare systems, long term care and income security. Demographics should be addressed by improving education, employment, public healthcare and social protection.
Artificial intelligence and digital technologies can help improve productivity, increase access to knowledge and encourage innovation. However, they can also change how employment is organised and create further inequality if everyone doesn’t have equal access to devices, connectivity and digital skills.
Digital inclusion should not just be about individuals having access to the internet. Learners and employees need to be able to critically analyse information, interpret data, identify bias, problem solve and make judgements based on outputs from automated systems. As AI becomes more embedded within education, administration and employment this becomes more important.
Public policy should invest in digital infrastructure within schools, training teachers, providing affordable learning opportunities for employees, supporting small businesses and experimenting responsibly with AI. Resources should be available in local languages and accessible for individuals with varying levels of literacy and digital skills. Technology should empower individuals and enable them to make judgements.
Institutional capacity plays a key role in anti-poverty schemes, education improvements and employment. The Economic Survey 2025-26 discusses concerns around corporate incentives, regulatory arbitrage and inconsistent application of rules. This can affect productivity, competitiveness and learning by doing. The IMF Article IV Consultation 2025 discusses administrative processes, customs and business environment. This highlights the importance of having predictable institutions and effective delivery. However, this should be understood in the context of the reports and the enterprises being looked at.
Pratap Bhanu Mehta, a prominent political scientist and public intellectual, former Vice-Chancellor of Ashoka University and former President of the Centre for Policy Research, writes an opinion article on 30th October 2026 discussing wider issues around administrative reform, institutional credibility, trust and decentralisation. Whilst this isn’t statistical evidence, it contributes to an important public policy debate around whether institutions are responding effectively to citizens and whether reforms are making a difference.
Institutional performance is crucial for effective education, women’s livelihoods, and skills development. Schools need skilled staff and accountability; women’s programmes require access to finance and childcare; and skills training must connect to job opportunities. Policies should integrate education with nutrition and healthcare, link women’s livelihoods to care infrastructure and markets, and ensure that skills programmes align with enterprise development. Digital participation should focus on meaningful learning rather than just access to technology. District planning must rely on solid evidence and capable institutions. India’s improvement in poverty reduction is notable, with the World Bank and NITI Aayog reporting significant progress. Welfare measures have protected household consumption, but crossing the poverty threshold does not guarantee comprehensive human progress. Households may still face insecure employment, limited savings, and inadequate protection against shocks.
It is essential to distinguish between the reduction of poverty, the methods used to measure it, contributing factors, and the sustainability of improved living standards. Recognizing progress should not impede scrutiny of measurements, as both are vital for effective policy analysis.
Five connected priorities for further progress include:
1. Promoting productive employment and adequate wages.
2. Supporting women’s economic empowerment through resource control and access to markets.
3. Focusing education on learning outcomes and meaningful participation.
4. Strengthening health and nutrition systems to shield families from financial shocks, and
5. Ensuring public institutions address regional disparities with reliable data.
Economic security is interlinked with education, health, gender equality, and institutional performance. Development must focus not only on overall progress but also on who benefits and who remains vulnerable. Ultimately, sustainable progress is measured by individuals’ ability to withstand uncertainty and exercise control over their lives.
____________________
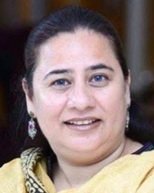
Dr Shabistan Gaffar is Chairperson of All India Confederation for Women’s Empowerment and ex-chairperson of the women’s cell of National Commission for Minority Educational Institutions (NCMEI). She can be reached at [email protected]
