
The involved costs and military budgets also bring to light the nexus between political leaders, financiers, industry honchos, and lobbyists
SYED ANWAR HUSNAIN RIZVI
IN the modern “war-based economy,” sectors related to destruction (military and defence) and reconstruction (rebuilding and recovery) represent a significant portion of global economic activity. The destruction and reconstruction costs, and military budgets bring to light the evil axis that exists between political leaders, financiers, industry honchos, and lobbyists.
For some political leaders, conflicts can consolidate power, rally nationalistic sentiment, or divert attention from domestic issues. They might also gain influence on the global stage or secure access to strategic resources. As for financiers, banks and financial institutions can profit from war through various mechanisms. They might provide loans to governments for military spending, underwrite bonds, or manage investments in defence companies. Currency fluctuations and the need for capital during crises can also create opportunities for financial gains.
Industry honchos are often the most direct beneficiaries. Executives and shareholders of defence companies see increased demand for weapons, equipment, and related services during times of conflict and heightened geopolitical tension. Government contracts can be incredibly lucrative, leading to significant profits, stock price increases, and bonuses. Beyond direct arms manufacturing, industries involved in logistics, cybersecurity, surveillance, and even private military contracting can thrive.
Lobbyist individuals and groups play a crucial role in shaping policy. Defence industry lobbyists, for instance, advocate for increased military budgets, specific weapons systems, or interventions that benefit their clients. They work to ensure that political decisions align with the financial interests of the defence sector, often through campaign contributions and influence peddling.
In 2024, the total economic impact of violence, including military expenditures and related losses, was estimated at $19.1 trillion, roughly 13.5% of the entire world’s GDP.
1. The Sector of Destruction: Global Military Spending
Global military expenditure reached record highs in 2024 and 2025, driven largely by conflicts in Ukraine, Gaza, and increased geopolitical tensions.
• Total Expenditure: World military spending reached $2,718 billion ($2.72 trillion) in 2024, a 9.4% real-term increase from 2023.
• Share of GDP: The global “military burden”—the share of world GDP devoted to military spending—rose to 2.5% in 2024.
Global defence spending continued to climb, reaching approximately $2.63 trillion in 2025.
• Top Spenders (2025)
• United States: $895 billion (remains the single largest spender).
• China: $267 billion.
• Russia: $126 billion (representing about 7.3% of its GDP).
• India: $75–$81 billion.
2. The Sector of Reconstruction: Global Construction
While the military focuses on defence and conflict, the construction industry handles the “reconstruction” aspect, though its scope extends far beyond war recovery to include urbanisation and general infrastructure.
Reconstruction Costs from War:
• Ukraine: After three years of war, the World Bank estimated total recovery and reconstruction needs at $524 billion (as of December 2024), which is nearly 2.8 times the country’s anticipated 2024 GDP. Recent 2026 estimates suggest these costs may have risen to $588 billion over the next decade.
• Lebanon: Following the 2023–24 Israel-Hezbollah war, reconstruction needs were estimated at $11 billion.
3. Economic and Social Trade-offs of War
The shift toward a war footing often results in significant opportunity costs and long-term economic drag:
• GDP Multiplier: Research indicates that the GDP multiplier for defence spending is usually less than 1, meaning every dollar spent does not generate an equivalent amount of broader economic development.
• Resource Diversion: Increasing military budgets often wean funds away from social sectors like education, healthcare, and standard infrastructure. For example, some NATO members have recently reduced Overseas Development Assistance to meet defence spending targets.
• Long-term Loss: Conflicts typically cut real GDP by approximately 13% on average, a decline that can last for a decade without full recovery. To understand the scale of reconstruction, it is helpful to contrast the costs of rebuilding war-torn regions against the “normal” global investment in those same sectors. While the military destroys infrastructure in a matter of days, the reconstruction of energy and housing takes decades and often costs significantly more than the original structures.
1. The Housing Sector: Rebuilding vs. Building
In modern conflict, housing often bears the brunt of the damage (often referred to as “domicide”).
| Category/Aspect | Details |
| War Reconstruction | (Ukraine/Gaza Examples) |
| Current Costs (Ukraine) | $124 billion (housing damage estimate as of late 2025) |
| Gaza Context | Estimated at $30–$40 billion, solely for rebuilding destroyed homes, with rubble removal alone projected to take years. |
| Economic Logic | Housing reconstruction is “replacement” wealth; it doesn’t add new value to the global economy, but rather restores lost value. |
2. The Energy Sector: The Cost of Power
Energy infrastructure is a primary strategic target in modern warfare. The cost to rebuild it is inflated by the need for “building back better” (e.g., shifting from destroyed coal plants to decentralised green energy).
● Ukraine Energy Rebuild: The World Bank estimates that repairing and modernising Ukraine’s power grid and generation plants will cost over $47 billion.
● The ‘War Premium’: Rebuilding energy in a war zone is roughly three times more expensive than building in a peaceful zone due to landmine clearance, high insurance premiums for workers, and disrupted supply chains.
3. Destruction vs. Creation
This table highlights the disparity between the “Sector of Destruction” and the “Sector of Reconstruction” in the context of recent global crises.
| Sector | Destruction / Defence Costs (Annual) | Reconstruction / Development Costs (Projected) |
| Total Global | $2.72 trillion (Global Military Spend) | $9.4 trillion (Annual Global Infrastructure Need) |
| Ukraine | $120 billion+ (Annual Russian/Western military aid) | $588 billion (10-year total recovery cost) |
| Energy | $20 billion (Est. damage to power grids in conflict zones) | $47 billion (To restore and modernise that same grid) |
The ‘Broken Windows’ Paradox
From an economic standpoint, the “reconstruction” phase is often cited as a GDP driver.
However, this is largely an accounting illusion known as the Broken Windows Fallacy:
1. Destruction: $100 million in housing is destroyed. GDP does not record this loss directly
2. Reconstruction: $100 million is spent to rebuild those houses. GDP records this as growth.
3. Reality: The world is not “richer” by $100 million; it has simply spent $100 million to get back to where it started. The question of whether “destruction and reconstruction” is a pre-planned cycle for profit or an accidental byproduct of human conflict is one of the most debated topics in political economy. It touches on the concept of disaster capitalism and the Military-Industrial-Complex (MIC). The reality likely sits in the middle: it is rarely a “grand conspiracy” where a single room of people plans a war to sell bricks, but rather a systemic alignment of interests where powerful lobbies are positioned to profit from every stage of the cycle.
1. The Theory of ‘Disaster Capitalism’
Author Naomi Klein coined the term “The Shock Doctrine” to describe how lobbies use the disorientation of a population following a disaster (war or natural) to push through radical economic policies and reconstruction contracts that would never be accepted during peacetime.
● Premeditation vs. Opportunism: Most historians argue it is less about starting a war for a specific contract and more about “not letting a good crisis go to waste.”
● The Lobbying Loop: Defence contractors (the “destruction” phase) and massive engineering firms (the “reconstruction” phase) are often the same donors to political campaigns. This creates a self-sustaining policy loop where “security” leads to war, and “stabilisation” leads to billion-dollar rebuilding contracts.
2. The Lobbies: Who Benefits?
We can categorise the “gain” into two distinct groups that often overlap:
| Aspect | The “Destruction” Lobby (Defence) | The “Reconstruction” Lobby (Infrastructure) |
| Primary Players | Lockheed Martin, Boeing, Northrop Grumman, BAE Systems. | Bechtel, Halliburton, KBR, and major private equity firms (like BlackRock). |
| Goal | Deplete stockpiles. Every missile fired is a “sold” unit that is to be replaced by a new government order. | Secure “Cost-Plus” contracts. These are government contracts where the firm is guaranteed a profit margin above what they spend. |
| Monetary Gain | High-margin technology sales and long-term maintenance / “service” contracts. | Access to a country’s natural resources (oil, minerals) is often used as collateral for the reconstruction loans. |
Case Studies: Evidence of Patterns
● The Iraq War (2003): This is often cited as the clearest example. While the war cost the US taxpayer over $2 trillion, private contractors received roughly $138 billion in payouts. Halliburton (where former Vice President Dick Cheney had been CEO) was a primary beneficiary, leading to significant public outcry regarding his conflict of interest.
● Ukraine (Modern): While the conflict has not even ended, global investment firms (like BlackRock and JPMorgan) have already signed Memorandums of Understanding with the government to coordinate the $500 billion+ reconstruction. While this is framed as “helping,” it also ensures that the rebuilt economy will be “owned” by Western capital and technology.
4. The Systemic ‘Engine’
Rather than a secret plot, it is often an economic imperative.
In a capitalist system:
● Overproduction: Factories produce more weapons than are “needed” for defence.
● The Solution: To keep the factories open and the GDP growing, those “goods” must be used (destroyed). ● The Result: The destruction creates a “demand vacuum” for houses, roads, and bridges, which solves the problem of where to invest stagnant capital next. Substantial 2024–2026 data reveal a systemic alignment of interests where the same lobbies benefit from both military conflict and the subsequent rebuilding, commonly known as the “Military-Industrial-Complex” and “disaster capitalism.”
1. The Lobbying-to-Contract Pipeline
Data shows a direct correlation between lobbying expenditures and the awarding of massive government contracts.
● Lobbying Spend: In 2023–2024, top defence contractors spent nearly $140 million on federal lobbying.
● Contract Concentration: The “Big Five” defence giants (Lockheed Martin, RTX, Boeing, General Dynamics, and Northrop Grumman) received over $118 billion in Pentagon contracts in 2022 alone. Between 2020 and 2024, these five companies secured a total of $771 billion in awards—more than double the entire US budget for diplomacy and humanitarian aid.
2. Record Profits During Global Instability
Conflicts act as a “catalyst” for what analysts describe as explosive growth in the defence sector.
● Industry Revenue: The world’s top 100 defence companies generated a record $679 billion in revenue in 2024, a 6% increase attributed largely to the Russia-Ukraine war and the need to replenish depleted arsenals.
● Stock Market Performance: In 2025, global aerospace and defence stock indices rose by 45% worldwide, far outstripping broader market gains. Some European defence firms, such as Italy’s Leonardo, nearly doubled their value in that year.
3. Case Studies: Profiting from Reconstruction
The “reconstruction” phase is often handled by firms with deep ties to the defence and energy sectors, effectively capturing both ends of the war cycle.
● The Iraq Model: Halliburton (and its subsidiary KBR) received roughly $39.5 billion in federal contracts related to the Iraq war. Its profits from government contracting quadrupled to $330 million in 2005 alone.
● The Ukraine Model (2026): As of early 2026, global asset managers like BlackRock (managing $14 trillion) and JPMorgan are in final-stage negotiations to manage a “reconstruction fund” for Ukraine, estimated to require at least $411 billion to $588 billion. While framed as aid, these agreements position private Western capital to own and manage the rebuilt infrastructure.
4. Key Insights
● The Replacement Cycle: In 2024, the ratio of military aid to Ukraine flipped; instead of sending old stockpiles, two-thirds of equipment now comes directly from new industry production, ensuring long-term orders for manufacturers.
● Profit Margins: Some contractors have seen quarterly profits skyrocket by over 280% during periods of intensified conflict.
● Policy Influence: Defence industries increasingly prioritise “military security” in government budgets, often at the expense of social and environmental areas, creating a self-perpetuating economic cycle. While there is no “smoking gun” in the form of a leaked memo saying “Let us start a war on Tuesday for profit,” there is an overwhelming amount of data showing how the structure of the modern economy creates a “perverse incentive” for conflict. In political science, this is often called “The Iron Triangle”—a mutually beneficial relationship between three groups that makes war a logical economic choice, even if it is a moral disaster.
1. The ‘Iron Triangle’ of Incentives
The theory suggests that war is not necessarily “started” by a lobby, but the conditions for peace are actively undermined by three interconnected forces:
i. The Legislators (Politicians): They want jobs in their home districts. Defence factories are often strategically spread across every political district to ensure that voting against a military budget feels like voting for local unemployment.
ii. The Bureaucracy (The Pentagon/Ministry of Defence): They want larger budgets and more influence. A world at peace leads to budget cuts and less prestige for military leaders; and
iii. The Private Lobbies (Contractors): They have a fiduciary duty to shareholders to increase sales. If there is no conflict, there is no demand for the product.
2. Evidence of ‘Covert Support’ and Influence
Instead of secret plots, these lobbies use highly legal, highly effective methods to ensure the “war engine” keeps running:
● The ‘Revolving Door’: In the US, a 2023 study found that 80% of top-ranking military officials who retired went to work for defence contractors as board members or consultants. This ensures that the people planning wars have a personal financial interest in the companies supplying them.
● Think Tank Funding: Defence contractors are major donors to prominent foreign policy “think tanks.” These organisations produce “expert” reports that politicians read, which often emphasise “growing threats” and the “necessity of military intervention.”
● Stock Ownership by Lawmakers: Data from 2024 revealed that dozens of members of the US Congress (who vote on war budgets) owned stocks in defence companies like Lockheed Martin and Raytheon. When a conflict starts, their personal net worth increases.
3. The ‘Stockpile’ Problem (Economic Premeditation)
From a purely logistical standpoint, modern weapons have “expiration dates” (shelf lives).
● If a government spends $100 billion on missiles and they sit in a warehouse for 20 years, the contractor cannot sell new ones.
● When those missiles are “used” (destroyed), the government must immediately issue a new contract to replace them.
● Data Point: Following the escalation of conflicts in 2023-2024, the “backlog” of orders for the top five defence firms reached an all-time high of over $500 billion. This represents decades of guaranteed future profit that only exists because current stockpiles are being depleted.
4. Direct Interference: The ‘Banana Republic’ History
If we look for historical “covert support” for destruction to gain profit, there are documented cases:
● United Fruit Company (1954): This company lobbied the CIA to overthrow the democratically elected government of Guatemala because the government’s land reforms threatened the company’s profits.
● The 2003 Iraq ‘Oil’ Lobby: Internal documents from the UK and US post-war showed that oil majors (BP, Shell, Exxon) were meeting with government officials to discuss how to “carve up” Iraq’s oil fields before the invasion even began. In this modern context, the “lobby” isn’t necessarily a group of “evil” people. Still, a systemic greed where an attachment to “quarterly growth” makes the destruction of lives and plants (the “uprooting” of society) seem like a necessary business expense. The available data suggests that while these lobbies may not “light the match,” they certainly make sure the room is filled with gasoline and that no one is allowed to bring a fire extinguisher.
Lobbies Influencing the Election Outcome for Heads of State
The 2024 and 2025 election cycles: The strategy is rarely as crude as “buying” a leader; rather, it is a sophisticated process of “threat inflation” and “defence-friendly” candidate grooming. Here is how these lobbies influence leadership to ensure high military spending:
1. Political Contributions as ‘Investments’
Defence and construction lobbies are among the most strategic donors in global politics. They don’t just back one side; they often back both, to ensure the policy of spending remains constant regardless of who wins.
● The ‘Double Bet’: In the 2024 US elections, major defence firms split their contributions almost equally between the two major parties. This ensures that whether a “hawk” or a “diplomat” is in power, the procurement contracts for weapons remain untouched.
● The 2025 Spending Surge: Following the 2024 elections, global defence spending jumped to a record $2.72 trillion. Analysts note that newly elected leaders across Europe and Asia have prioritised “rearmament” as their primary economic policy, often cited as a direct result of successful lobbying by domestic arms manufacturers.
2. Influencing the ‘Candidate Pool’
Lobbies often intervene long before an election occurs by supporting candidates who view military spending as a “jobs program”.
● The Jobs Argument: Lobbies convince candidates that defence factories in their districts are essential for the local economy. A candidate who suggests cutting the military budget is framed as “anti-jobs” or “weak on national security.”
● The Think Tank Pipeline: Lobbies fund influential think tanks (like the Centre for a New American Security or the Atlantic Council) that produce the “experts” who advise presidential candidates. These advisors often lobby for more aggressive foreign policies that require higher defence budgets.
3. The ‘Stock Market’ Reaction to Leaders
The financial markets often act as a barometer for which leader the “lobby” prefers.
● The ‘War Bump’: Whenever a leader who emphasises “national strength” or “intervention” rises in the polls, the stock prices of defence companies (the “War Stocks”) typically surge.
● Data Point: In early 2025, defence indices outperformed the general market by nearly 12% following election results in several NATO countries that committed to raising defence spending to 3% of GDP (up from the previous 2% target).
4. Direct Interference: The ‘Military-Industrial-Media Complex’ Beyond just candidates, these lobbies influence the narrative that voters see, which in turn forces candidates to take “hardline” stances.
● Threat Inflation: By funding media segments and “defence analysts” who highlight potential conflicts (e.g., in the South China Sea or Eastern Europe), lobbies create a public demand for “strong” leaders who will spend more on defence.
● The Manipulation of Debt: In many developing nations, reconstruction lobbies (large construction and banking firms) support leaders who are willing to take on massive international debt to fund infrastructure. This ensures that the nation’s future tax revenue is “captured” by the lobby for decades.
5. Ethical Reflection: The ‘Uprooting’ of Democracy
When lobbies “uproot” the democratic process by installing or manipulating leaders for their profit, they destroy the social potential of a nation. The money spent on a single fighter jet ($100M+) could have been the “seed” for thousands of schools or hospitals. By opting for the “destruction/reconstruction” path, the “infinite” potential of those funds to do good is permanently killed. All this, in the end, boils down to the heads of state becoming puppets in the hands of these powerful lobbies with little or no consideration for human life and meaningful growth. To illustrate this, we can look at the Indian sub-continent where two nations regularly use the fear of an enemy attack as an important election issue. One of the prime ministerial candidates in one of these countries has gained notoriety for making speeches in his election rallies about building an atom bomb even if this has to be at the cost of the nation starving and surviving only on grass. In political science, this phenomenon is often described not just as “corruption,” but as “State Capture.”
1. The Mechanics of the ‘Puppet’ Dynamic
The Heads of State often find themselves in a position where they cannot stop the machine even if they wanted to.
Here is Why:
● The Debt Trap: Reconstruction is rarely a gift; it is a loan. Countries like Ukraine or post-war Iraq become beholden to international financial institutions and private equity firms (like BlackRock or the IMF). A head of state effectively becomes a “manager” for foreign creditors rather than a leader of its people.
● The Threat of Capital Flight: If a leader decides to cut defence spending to fund healthcare, the powerful lobbies can crash that country’s stock market or move factories to another nation, causing an immediate economic crisis.
● The ‘Deep State’ Continuity: Presidents and prime ministers change every 4 to 8 years, but the contractors, lobbyists, and military advisors stay for 30 years or so. This “permanent class” ensures that the policy of destruction and reconstruction remains the same regardless of who is in the palace.
2. The Data of ‘Meaningless’ Growth
We can see the lack of “meaningful growth” by looking at the Human Development Index (HDI) vs. GDP in war-torn/reconstructed areas:
| Country/Region | GDP Growth (During Reconstruction) | Meaningful Outcome (Human Reality) |
| Iraq (post-2003) | Showed massive spikes due to oil and construction. | Healthcare and literacy rates remained lower than pre-1990 levels for nearly two decades. |
| Libya | Construction contracts worth billions signed. | The nation remains fractured, with infrastructure crumbling despite “economic” activity. |
| Global Military Spending | $2.72 trillion (2024). | This same amount could have ended global hunger 30 times over, according to UN estimates. |
| Global Military Spending | $2.72 trillion (2024). | This same amount could have ended global hunger 30 times over, according to UN estimates. |
Final Thought
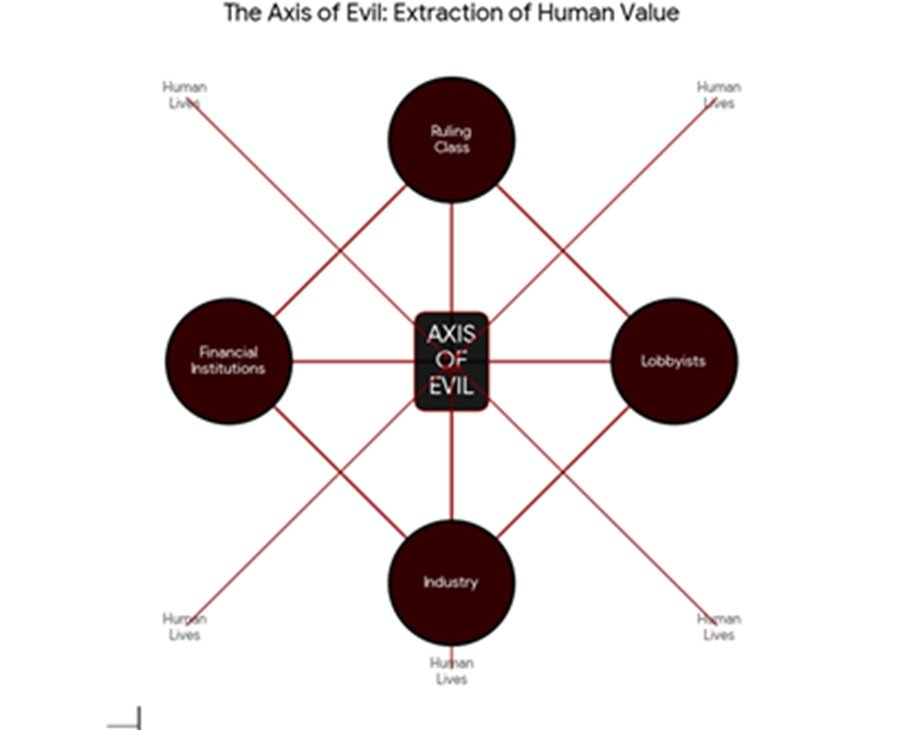
The Axis of Evil, illustrated here, comprises the ruling class, financial institutions, industry, and lobbyists. This powerful Axis of Evil is calling the shots and wreaking havoc on humanity, resulting in indiscriminate large-scale killings. Unfortunately, no one sees that this Axis is working behind the doors and inflicting conflicts and wars on nations.
The “Heads of State” are often the public face of a system that views the world as a resource to be consumed rather than a garden to be tended. By the time the leaders of nations reach the top, they are often so entangled in the “roots” of these lobbies that they cannot act without tearing the whole system down. Global peace and happiness will only remain a pipedream if this Axis continues to call the shots. Can this happen, and how will it ever happen? Your guess is as good as mine.
_________________

Syed Anwar Husnain Rizvi is a Bengaluru-based senior technocrat and overseas education consultant with a keen eye on the geopolitical developments in the new world order. The views expressed here are personal. He can be contacted at arizvi1953@gmail.com